Understanding Crypto Market Cycle: A Guide to Bull and Bear Markets
Crypto Market Cycle is the name we give to those waves. It’s the repeating pattern of rises and falls in cryptocurrency prices. Understanding the cycle helps you make calmer choices. In the paragraphs below we’ll walk through the main phases of a cycle, how people read the signs, and practical ways to act — not gamble — when markets turn.
What is a Crypto Market Cycle?

A Crypto Market Cycle is a broad pattern that markets follow over time. It includes periods when prices rise sharply (bull markets) and times when prices fall or stay low (bear markets). Between these extremes are stages where the market slows, recovers, or consolidates.
Cycles are not exact clocks. They vary in length and size. Some cycles last months. Others last years. But the shape — rise, peak, fall, recovery — repeats. Knowing the parts of that shape helps you plan and avoid panicked moves.
Four main stages of the cycle
Most people describe four practical stages:
- Accumulation: Prices are low or stable. Smart money and patient investors add positions. News is often slow.
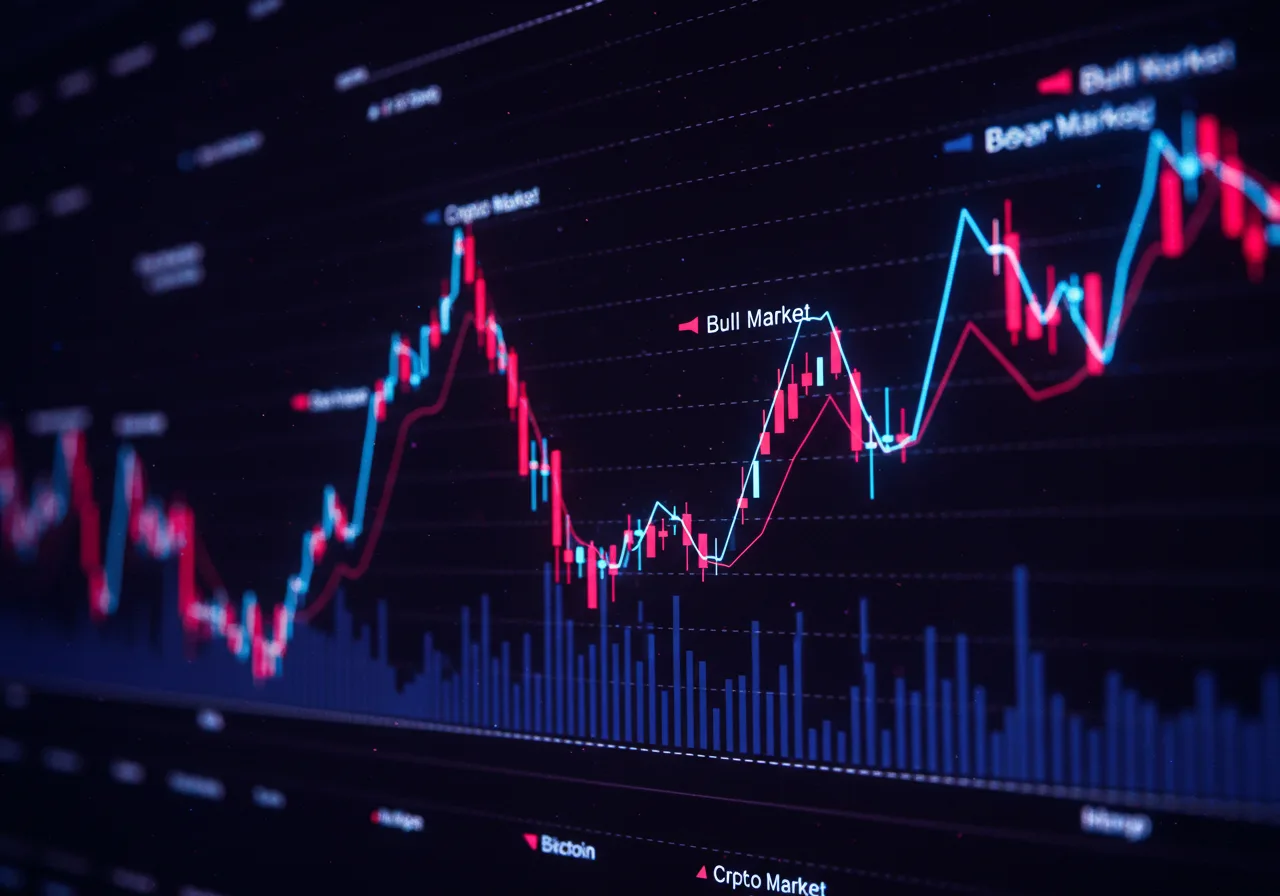
- Uptrend (Bull Phase): Prices rise. More people join. Media attention grows. This is the exciting part.
- Euphoria/Peak: Fears are gone. Prices may run too high. Risk increases. Some assets become overheated.
- Downtrend (Bear Phase): Prices fall. Panic and selling follow. The market may correct deeply before stabilizing.
Seeing these stages helps you recognize where the market might be and how others are behaving.
Reading the market: simple tools and signs
You do not need advanced math to read cycles. A few tools and signs go a long way.
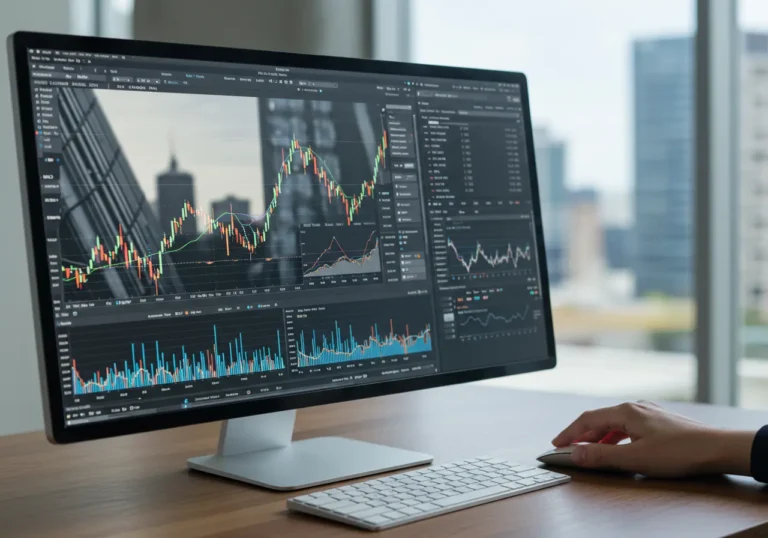
Price charts and trend lines
Look at simple price charts over months and years. Is the overall shape moving up, flat, or down? Trend lines help show direction. A long green climb often signals a bull phase. Long red falls point to a bear market.
Volume and participation
Volume shows how many people are trading. High volume during price rises often means strong interest. High volume during falls can mean panic selling. Watching volume is part of market sentiment indicators analysis.
Market breadth
On traditional markets, breadth measures how many assets participate in a rise. In crypto, if many altcoins follow Bitcoin up, the cycle is broad. If only one token rises, the movement may be narrow and risky.
Sentiment and headlines
Simple sentiment tools — community mood, news headlines, and social mentions — give context. When headlines talk of “everyone getting rich,” caution is wise. That’s part of market sentiment indicators analysis.
Historical patterns
Looking back at past cycles helps. Historical data correlation analysis can show how Bitcoin and altcoins reacted in past cycles. History does not repeat exactly, but it often rhymes.
Bitcoin and altcoins: different roles in cycles

Bitcoin often leads the market. When Bitcoin moves strongly, many altcoins follow later. Watching Bitcoin gives a head start.
- Bitcoin bull market analysis often focuses on macro factors: adoption, halving events, and large investor flows.
- Altcoin market cycle trends can be more volatile. They often rally after Bitcoin starts a bull phase, then fall harder during bear phases.
Knowing the difference helps you decide where to put your focus. If you want lower volatility, many choose Bitcoin. If you seek higher short-term gains (and accept higher risk), altcoins are an option.
Simple ideas about prediction and why to be cautious
Some people look for a cryptocurrency price prediction model to tell them exactly when to buy or sell. Models can help, but they do not give certainty.
- Models use past data, sentiment, and on-chain metrics.
- They offer probabilities, not promises.
- Markets are influenced by news, regulation, and human behaviour that models cannot fully capture.
Treat predictions as guides. Use them to form a view, not a guarantee. Always ask: “What could go wrong?” That question keeps you humble and prepared.
Practical actions for each stage
Here are calm, helpful actions you can take depending on the stage of the cycle.
During accumulation
- Consider building positions slowly.
- Use dollar-cost averaging (DCA) to spread buys.
- Avoid leverage. Markets may feel cheap for a while.
During uptrends
- Enjoy gains but lock in profits occasionally.
- Rebalance: move some profit into safer assets or stablecoins.
- Watch for euphoric signs: extreme FOMO (fear of missing out) and big media stories.
At peaks
- Reduce risk exposure.
- Don’t chase the final spikes. They often reverse fast.
- Have an exit plan if prices fall a set percentage.
During downtrends
- Stay calm. Avoid panic selling if you can.
- Look for quality opportunities; some assets become good value.
- Remember unbonding and lock-up periods for some investments — you may not move quickly.
These actions are not investment advice. They are simple habits that help you think clearly.
Indicators some traders use (simple and friendly)
Traders use many indicators. Here are a few that are easy to understand:
- Moving Averages: shows average price over time. Crossovers can hint at trend changes.
- Relative Strength Index (RSI): shows if an asset is overbought or oversold.
- On-chain metrics: look at network activity, transaction volumes, and new wallet addresses. These feed into Historical data correlation analysis and Market sentiment indicators analysis.
Combine indicators. No single tool is perfect.
Emotions, psychology, and safety
Markets are human places. Emotions matter.
- Fear and greed drive big swings.
- Plans and rules reduce emotional mistakes.
- Avoid checking prices constantly. It often makes emotions stronger.
Have simple rules: how much you’ll invest, what percentage of gains to lock up, and when to pause. These rules are your guardrails.
Examples from real cycles (simple stories)
- In the 2017 cycle, Bitcoin surged and many altcoins skyrocketed. After the peak, prices collapsed and many projects faded. That taught the community about risk.
- In a later cycle, better projects, exchanges, and regulation meant some assets found longer-term support. The swings were still big, but some lessons were learned about quality and custody.
Stories help show that cycles evolve and that learning matters.
Tools and resources to learn more
- Price charts (CoinMarketCap, CoinGecko).
- On-chain dashboards (Glassnode, Dune) for Historical data correlation analysis.
- Sentiment trackers and simple news feeds for market sentiment indicators analysis.
- Educational blogs and community forums to hear different views.
Mix reading with small practice. Start with little amounts and a simulated plan.
Conclusion — thinking long term and staying steady
A Crypto Market Cycle moves in waves. You cannot stop the ocean. But you can learn to swim. Keep a long-term view, use simple tools, and make plans before emotion drives choices. Mix learning with small steps. Watch Bitcoin bull market analysis and altcoin market cycle trends, but treat predictions and models as helpers, not crystals.
The market will surprise you. That is part of the game. With clear habits and respect for risk, you can be ready when the tide turns.
Quick takeaways
- Crypto Market Cycle = repeating pattern of bull and bear phases.
- Watch stages: accumulation, uptrend, peak, downtrend.
- Use simple tools: trend lines, volume, moving averages, and sentiment.
- Bitcoin bull market analysis often leads market direction; altcoin market cycle trends follow with more volatility.
- Treat cryptocurrency price prediction model outputs as guides, not certainties.
- Use market sentiment indicators analysis and historical data correlation analysis to build perspective.
- Plan rules ahead: position sizes, profit locking, and risk limits.
FAQ
Q: How long does a crypto market cycle last?
A: It varies. Some cycles are months; others span years. There is no fixed length.
Q: Can I make reliable predictions with models?
A: Models help form views but do not guarantee outcomes. Use them alongside other information.
Q: Should I sell at the first sign of a bear market?
A: Not automatically. Consider your plan, risk tolerance, and whether you can hold through volatility.
Q: Do altcoins always follow Bitcoin?
A: Often they follow trends, but not always. Some altcoins have independent drivers.
Q: Where can I learn more about market indicators?
A: Start with charting tools and beginner guides on moving averages, RSI, and volume. Then try simple on-chain dashboards.
Table of Contents

Hello, I’m Edmilson Dias, founder of CoinBringer. I created this platform to guide people through the fast-moving world of cryptocurrency with clarity and safety. With years of research in blockchain and digital security, my goal is to translate complex topics into practical knowledge, offering reliable tutorials, safety insights, and guidance for both newcomers and experienced users.
Discover more from CoinBringer
Subscribe to get the latest posts sent to your email.